Strategic
Product Management with the HDTE Model: A Modern Twist on the BCG Matrix
Abstract:
The HDTE Model refines strategic
product management by categorizing products into four quadrants: Horse, Dog,
Tiger, and Elephant, inspired by the traditional BCG Matrix. This model uses
adjusted formulas for relative market share and market growth rate to provide a
nuanced view of market dynamics, guiding businesses in developing strategies
for investment, marketing, divestment, and profit maximization.
Comparative analysis between the BCG
Matrix and HDTE Model highlights potential benefits but also identifies areas
for further research. Future studies could include empirical validation across
industries, longitudinal assessments of long-term impacts, and sector-specific
case studies in fields like technology and healthcare. Quantitative analysis of
financial outcomes, strategic flexibility, integration with modern
technologies, and cross-cultural applicability are also key areas for
exploration. Addressing these areas will enhance understanding of the HDTE
Model's advantages, guiding businesses in selecting the most effective
strategic framework.
KEY WORDS – strategic product
management, HDTE, Twist ,BCG matrix
Introduction:
In the ever-evolving business
landscape, understanding a product's market position is crucial for strategic
decision-making. Since its introduction in 1970, the Boston Consulting Group
(BCG) Matrix has been a cornerstone for categorizing products based on market
growth rate and relative market share. However, as market dynamics become more
complex, a more nuanced approach is necessary to capture additional competitive
factors. The HDTE Model—Horse, Dog, Tiger, and Elephant—emerges as a refined
framework to address this need, enhancing the traditional BCG metrics with
adjusted formulas for relative market share and market growth rate.
The HDTE Model categorizes products
into four distinct quadrants: Horse (high growth, low share), Dog (high growth,
high share), Tiger (low growth, low share), and Elephant (low growth, high
share). This model introduces an adjusted relative market share formula that
considers the market shares of both the leading and challenger competitors,
along with a fraction of the company's own market share. Additionally, it
proposes a revised market growth rate formula, normalizing growth over a 60-day
period to provide a daily growth rate.
By incorporating these adjustments,
the HDTE Model offers a more comprehensive view of a product’s competitive
position, allowing businesses to devise more targeted strategies. This paper
explores the strategic applications of the HDTE Model, demonstrating how it can
guide investment, marketing, divestment, and profit maximization decisions. By
aligning product characteristics with specific strategic actions, the HDTE
Model ensures effective management and optimization of overall business performance;
representing a valuable evolution of the traditional BCG Matrix tailored to
today's complex market environment.
The comparative analysis of the BCG
Matrix and the HDTE Model lays the groundwork for understanding the differences
and potential benefits of the HDTE Model. However, this initial analysis
highlights several opportunities for further research to expand our
understanding and validation of the HDTE Model's effectiveness. Future research
could include empirical validation through studies across various industries to
compare the performance of the HDTE Model with the traditional BCG Matrix in
real-world settings. Longitudinal studies could assess the long-term impact of
adopting the HDTE Model on business performance and market positioning.
Additionally, sector-specific case
studies in technology, healthcare, and consumer goods can provide insights into
the model's applicability across different contexts. Quantitative analysis can
measure the financial outcomes and market success of companies using the HDTE Model
versus those using the BCG Matrix. Further research could also investigate the
strategic flexibility and adaptability of both models, their integration with
modern technologies, cross-cultural applications, customer perception and brand
impact, competitor analysis, and support for sustainability and innovation.
Addressing these areas can significantly enhance our understanding of the HDTE
Model's comparative advantages and limitations, ultimately guiding businesses
in selecting the most effective strategic framework for their needs.
Literature Review –
The foundational concept of the BCG
matrix, introduced by Henderson in "The Product Portfolio" (1970),
emphasizes the strategic categorization of business units and products to
optimize resource allocation. Wind and Mahajan (1981) discuss its strategic
applications in long-term planning in "Designing Product and Business
Portfolios," while Day (1977) critiques its simplicity in "Diagnosing
the Product Portfolio," advocating for supplementary tools. Empirical
applications and limitations are illustrated through case studies by Kotler and
Keller in "Marketing Management" (2016) and by Aaker in
"Strategic Market Management" (2008). Doyle (1998) in "Marketing
Management and Strategy" critiques the BCG matrix's static nature,
proposing alternative frameworks, while Mintzberg and Lampel (1999) in
"Reflecting on the Strategy Process" call for more dynamic
approaches. Grant (2016) in "Contemporary Strategy Analysis" explores
adaptations for the digital era, and Johnson, Scholes, and Whittington (2020)
in "Exploring Strategy: Text and Cases" examine its relevance in
modern strategic management.
Haradhan Kumar Mohajan (2018)
analyzes how the BCG matrix can help identify which strategic business units to
invest in, sell, or shut down, aiding companies in efficient resource
distribution and management. The paper serves as a guideline for businesses to
adopt optimal strategies using the BCG matrix. Chih-Chung Chiu and Kuo-Sui Lin
(2019) critique the traditional BCG matrix as a static tool that fails to
consider different time frames. Their study proposes a dynamic BCG method
incorporating trend analysis and varying time frames for product portfolio
evaluation. A numerical case study demonstrates the effectiveness of this new
method in assessing company products' market positions and formulating resource
allocation strategies. The rule-based BCG method introduces a new data
collection approach using a vague set and provides a novel application for
strategic market positioning and resource strategy development.
Analyses and
discussion
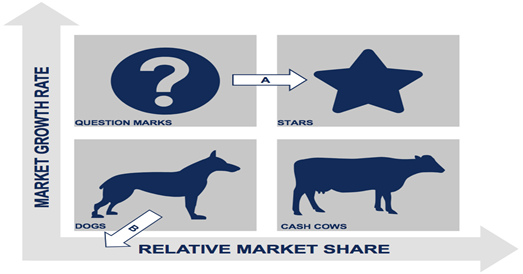
The BCG Matrix uses the horizontal
axis to represent a product's market share and competitive strength, measured
through relative market share. The vertical axis shows the product's market growth
rate and potential. The matrix includes four quadrants: Question Marks (high
growth, low share), Stars (high growth, high share), Dogs (low growth, low
share), and Cash Cows (low growth, high share). It assumes that higher relative
market share leads to increased cash flow due to economies of scale and cost
advantages. Typically, a 10% market growth rate is the threshold between high
and low growth.
The formula for calculating relative
market share is:
Relative Market Share=Company’s Market Share/Largest Competitor’s Market Share
This ratio compares a company's
market share to that of its largest competitor in the same industry, providing
insight into the company's competitive position.
To be modified as
Adjusted Relative Market Share=(Leader Competitor’s Market Share+Challenger Competitor’s Market Share
Company’s Market Share/4 )×100
In this formula:
- Company’s Market Share: The market share of the company being analyzed.
- Leader Competitor’s Market Share: The market share of the leading competitor.
- Challenger Competitor’s Market Share: The market share of the challenger competitor.
- Company’s Market Share/4: One-quarter of the company's market share added to
the denominator.
This formula provides an adjusted
relative market share that considers both the leader and the challenger
competitor's market shares, along with a fraction of the company's own market
share
The formula for calculating market
growth rate is:
Market Growth Rate=Current Market Size−Previous Market Size/Previous Market Size×100
In this formula:
- Current Market Size:
The total market size at the end of the period.
- Previous Market Size:
The total market size at the beginning of the period.
This formula provides a percentage
that represents the rate of change in the market size over time. It's essential
for companies to understand the market growth rate to make informed decisions
about investment, product development, and market positioning.
By modified above formula
Calculate
the growth rate using the leader's market size, challenger's market size, and X
Company’s market size over a period of 60 days;
Growth Rate=(Leader Market Size−Challenger Market Size/ Company Market Size×100/60
This formula represents the growth
rate per day, as it normalizes the growth over the 60-day period. Let's break
it down step by step:
- Difference in Market Size:
Leader Market Size−Challenger Market Size
gives the difference between the market sizes of the leader and the challenger.
- Normalized by X Company Market Size:
Dividing the difference by X Company Market Size
normalizes this difference with respect to X company's market size.
- Conversion to Percentage:
- Multiplying by 100 converts this value to a
percentage.
- Normalization over 60 days:
- Dividing by 60 days provides a daily growth rate.
Thus, this formula provides a
percentage growth rate normalized to a daily rate over a 60-day period.
|
|
|
|
Market
Growth Rate

|
|
|
|
Adjusted Relative Market Share
The matrix plots a company’s offerings in a four-square
matrix, with the y-axis representing the rate of market growth and the x-axis
representing market share. It was introduced by the Boston Consulting Group in
1970. But this model was modified with some microscopic changes for present scenario
HDTE
MODEL PRODUCT PORTFOLIO ANALYSIS
.
- Horse:
Products with high market growth but a low market share.
- Dog:
Products with high market growth and a high market share.
- Tiger:
Products with low market growth and a low market share.
- Elephants:
Products with low market growth but a high market share.
Let's elaborate on each of these
categories:
1.
Horse: Products with High Market Growth but Low Market Share
Characteristics of a Horse:
- Agile and fast, but needs direction and nurturing to
become a champion.(product penetration )
Business Strategy:
- Investment:
Like training a young horse, these products need significant investment to
improve their capabilities and increase market share.
- Marketing:
Promote the product vigorously to build brand awareness and capture a
larger market segment.
- Innovation:
Continue to innovate and improve the product to gain a competitive edge in
the growing market.
Example:
- A new tech gadget in a rapidly expanding market with
many competitors.
2.
Dog: Products with High Market Growth and High Market Share
Characteristics of a Dog:
- Loyal, strong, and a leader in its territory.(market
penetration)
Business Strategy:
- Sustainability:
Maintain the product's dominant position through ongoing investment in
marketing and innovation, much like keeping a dog healthy and active.
- Expansion:
Explore new markets or diversify offerings to capitalize on growth
opportunities.
- Efficiency:
Improve operational efficiencies to maximize profit margins and ensure the
product continues to lead in the market.
Example:
- A leading smartphone brand that dominates a growing
market.
3.
Tiger: Products with Low Market Growth and Low Market Share
Characteristics of a Tiger:
- Fierce but isolated, struggles to thrive in a declining
environment.( liquidation /Divestiture)
Business Strategy:
- Divestment:
Consider discontinuing the product to allocate resources more effectively,
similar to a tiger being moved to a more suitable habitat.
- Niche Focus:
Identify and target niche markets where the product might perform better.
- Cost Management:
Minimize costs to reduce losses, ensuring the product doesn't drain
resources.
Example:
- An outdated technology product in a market that's being
overtaken by newer innovations.
4.
Elephant: Products with Low Market Growth but High Market Share
Characteristics of an Elephant:
- Large, stable, and strong, commanding respect in its
environment.( concentric Diversification)
Business Strategy:
- Profit Maximization:
Focus on maintaining efficiency and maximizing profits, like ensuring an
elephant is well-cared-for to keep it strong.
- Cost Control:
Keep operational costs low to maintain high profitability.
- Harvesting:
Use the steady revenue generated by these products to fund other growth
opportunities within the business.
Example:
- A well-established household product that enjoys a
loyal customer base in a stable market.
By aligning product categories with
these animal characteristics, businesses can develop targeted strategies that
leverage the inherent strengths and weaknesses of each product type, ensuring
they are managed effectively to maximize overall business performance.
Limitation of HDTE model – The
HDTE Model's complexity, data demands, and reliance on static assumptions limit
its effectiveness across diverse, dynamic market conditions.
.
Conclusion: The HDTE Model offers a contemporary framework for
strategic product management by refining the categorization of products based
on market dynamics. By incorporating adjusted metrics for relative market share
and market growth rate, this model provides a more comprehensive view of a
product's competitive position. The animal characteristics—Horse, Dog, Tiger,
and Elephant—serve as intuitive metaphors for understanding the strategic needs
of each product category. Through targeted strategies, such as investment,
marketing, divestment, and profit maximization, businesses can effectively
manage their product portfolios to enhance overall performance. The HDTE Model
thus represents a valuable evolution of the traditional BCG Matrix, better
suited to the complexities of today's market environment. Comparative
Analysis of BCG Matrix and HDTE Model
References
References
- Aaker, D. A. (2008). Strategic Market Management.
John Wiley & Sons.
- Chiu, C.-C., & Lin, K.-S. (2019). Rule-Based BCG
Matrix for Product Portfolio Analysis. In Studies in Computational
Intelligence (Vol. 850).
- Day, G. S. (1977). Diagnosing the Product Portfolio. Journal
of Marketing.
- Doyle, P. (1998). Marketing Management and Strategy.
Prentice Hall.
- Grant, R. M. (2016). Contemporary Strategy Analysis.
Wiley.
- Henderson, B. D. (1970). The Product Portfolio. BCG
Perspectives.
- Johnson, G., Scholes, K., & Whittington, R. (2020).
Exploring Strategy: Text and Cases. Pearson.
- Kotler, P., & Keller, K. L. (2016). Marketing
Management. Pearson.
- Mintzberg, H., & Lampel, J. (1999). Reflecting on
the Strategy Process. Sloan Management Review.
- Mohajan, H. K. (2018). An Analysis on BCG Growth
Sharing Matrix. Noble International Journal of Business and Management,
2(1), 1-6.
- Wind, Y., & Mahajan, V. (1981). Designing Product
and Business Portfolios. Harvard Business Review.


No comments:
Post a Comment